
# sql性能分析
# 1. 查询sql执行频率
-- 查看当前数据库的 INSERT, UPDATE, DELETE, SELECT 访问频次:
-- SHOW GLOBAL STATUS LIKE 'Com_______'; 或者 SHOW SESSION STATUS LIKE 'Com_______';
mysql> show global status like 'Com_______';
+---------------+-------+
| Variable_name | Value |
+---------------+-------+
| Com_binlog    | 0     |
| Com_commit    | 3     |
| Com_delete    | 0     |
| Com_import    | 0     |
| Com_insert    | 0     |
| Com_repair    | 0     |
| Com_revoke    | 0     |
| Com_select    | 1452  |
| Com_signal    | 0     |
| Com_update    | 0     |
| Com_xa_end    | 0     |
+---------------+-------+
11 rows in set (0.01 sec)
1
2
3
4
5
6
7
8
9
10
11
12
13
14
15
16
17
18
19
20
2
3
4
5
6
7
8
9
10
11
12
13
14
15
16
17
18
19
20
# 2. 慢查询日志
-- 慢查询日志记录了所有执行时间超过指定参数(long_query_time,单位:秒,默认10秒)的所有SQL语句的日志。
-- MySQL的慢查询日志默认没有开启,需要在MySQL的配置文件(/etc/my.cnf)中配置如下信息:

-- 开启慢查询日志开关
slow_query_log=1
--  设置慢查询日志的时间为2秒,SQL语句执行时间超过2秒,就会视为慢查询,记录慢查询日志
long_query_time=2
1
2
3
4
5
6
7
2
3
4
5
6
7
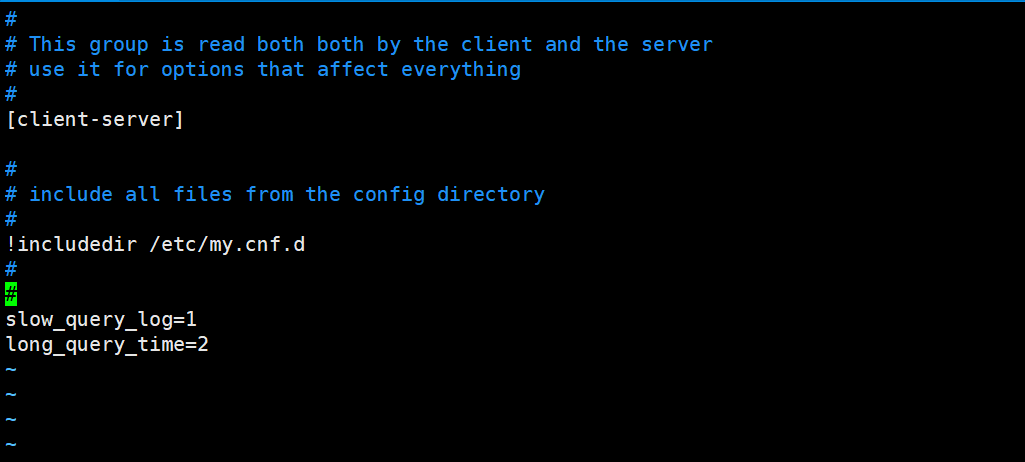
-- 使用修改配置文件的方式不生效
mysql> set global slow_query_log='ON';
Query OK, 0 rows affected (0.00 sec)

-- 查看慢查询日志开关状态:
mysql> show variables like 'slow_query_log';
+----------------+-------+
| Variable_name  | Value |
+----------------+-------+
| slow_query_log | ON    |
+----------------+-------+
1 row in set (0.00 sec)

-- 设置慢查询log的位置
mysql> set global slow_query_log_file='/var/lib/mysql/localhost-slow.log';
Query OK, 0 rows affected (0.00 sec)

-- root@iZ2ze58f53sxjm9z7mgn5xZ ~]# ls /var/lib/mysql/localhost-slow.log
-- /var/lib/mysql/localhost-slow.log
1
2
3
4
5
6
7
8
9
10
11
12
13
14
15
16
17
18
19
20
2
3
4
5
6
7
8
9
10
11
12
13
14
15
16
17
18
19
20
# 3. profile
-- show profile 能在做SQL优化时帮我们了解时间都耗费在哪里。通过 have_profiling 参数,能看到当前 MySQL 是否支持 profile 操作:

-- 查看是否支持 profile
mysql> SELECT @@have_profiling;
+------------------+
| @@have_profiling |
+------------------+
| YES              |
+------------------+
1 row in set, 1 warning (0.00 sec)


-- profiling 默认关闭,可以通过set语句在session/global级别开启 profiling:
-- 查询是否打开profile
mysql> select @@profiling;
+-------------+
| @@profiling |
+-------------+
|           0 |
+-------------+
1 row in set, 1 warning (0.00 sec)

-- 设置profiling
mysql> set profiling = 1;
Query OK, 0 rows affected, 1 warning (0.00 sec)

-- 设置完成查看已经打开
mysql> select @@profiling;
+-------------+
| @@profiling |
+-------------+
|           1 |
+-------------+
1 row in set, 1 warning (0.00 sec)


-- 使用 查询每一条sql的耗时时长
mysql> show profiles;
+----------+------------+----------------------------+
| Query_ID | Duration   | Query                      |
+----------+------------+----------------------------+
|        1 | 0.00016250 | select @@profiling         |
|        2 | 0.00429275 | select * from gorm_db.user |
+----------+------------+----------------------------+
2 rows in set, 1 warning (0.00 sec)


-- 查看指定query_id的SQL语句各个阶段的耗时:
mysql> show profile for query 2;
+--------------------------------+----------+
| Status                         | Duration |
+--------------------------------+----------+
| starting                       | 0.000072 |
| Executing hook on transaction  | 0.000007 |
| starting                       | 0.000008 |
| checking permissions           | 0.000007 |
| Opening tables                 | 0.003542 |
| init                           | 0.000013 |
| System lock                    | 0.000009 |
| optimizing                     | 0.000004 |
| statistics                     | 0.000011 |
| preparing                      | 0.000014 |
| executing                      | 0.000548 |
| end                            | 0.000009 |
| query end                      | 0.000004 |
| waiting for handler commit     | 0.000008 |
| closing tables                 | 0.000007 |
| freeing items                  | 0.000019 |
| cleaning up                    | 0.000012 |
+--------------------------------+----------+
17 rows in set, 1 warning (0.00 sec)

-- 查看指定query_id的SQL语句CPU的使用情况
mysql> show profile cpu for query 2;
+--------------------------------+----------+----------+------------+
| Status                         | Duration | CPU_user | CPU_system |
+--------------------------------+----------+----------+------------+
| starting                       | 0.000072 | 0.000000 |   0.000071 |
| Executing hook on transaction  | 0.000007 | 0.000000 |   0.000006 |
| starting                       | 0.000008 | 0.000000 |   0.000008 |
| checking permissions           | 0.000007 | 0.000000 |   0.000006 |
| Opening tables                 | 0.003542 | 0.001278 |   0.002237 |
| init                           | 0.000013 | 0.000008 |   0.000005 |
| System lock                    | 0.000009 | 0.000005 |   0.000003 |
| optimizing                     | 0.000004 | 0.000003 |   0.000001 |
| statistics                     | 0.000011 | 0.000006 |   0.000004 |
| preparing                      | 0.000014 | 0.000009 |   0.000006 |
| executing                      | 0.000548 | 0.000103 |   0.000064 |
| end                            | 0.000009 | 0.000005 |   0.000004 |
| query end                      | 0.000004 | 0.000003 |   0.000002 |
| waiting for handler commit     | 0.000008 | 0.000005 |   0.000003 |
| closing tables                 | 0.000007 | 0.000004 |   0.000002 |
| freeing items                  | 0.000019 | 0.000012 |   0.000008 |
| cleaning up                    | 0.000012 | 0.000007 |   0.000004 |
+--------------------------------+----------+----------+------------+
17 rows in set, 1 warning (0.00 sec)
1
2
3
4
5
6
7
8
9
10
11
12
13
14
15
16
17
18
19
20
21
22
23
24
25
26
27
28
29
30
31
32
33
34
35
36
37
38
39
40
41
42
43
44
45
46
47
48
49
50
51
52
53
54
55
56
57
58
59
60
61
62
63
64
65
66
67
68
69
70
71
72
73
74
75
76
77
78
79
80
81
82
83
84
85
86
87
88
89
90
91
92
93
94
95
96
97
2
3
4
5
6
7
8
9
10
11
12
13
14
15
16
17
18
19
20
21
22
23
24
25
26
27
28
29
30
31
32
33
34
35
36
37
38
39
40
41
42
43
44
45
46
47
48
49
50
51
52
53
54
55
56
57
58
59
60
61
62
63
64
65
66
67
68
69
70
71
72
73
74
75
76
77
78
79
80
81
82
83
84
85
86
87
88
89
90
91
92
93
94
95
96
97
# 4. explain 执行计划
explain 或者 DESC 命令获取 MySQL 如何执行 SELECT 语句的信息,包括在 SELECT 语句执行过程中表如何连接和连接的顺序。
--  直接在select语句之前加上关键字 explain / desc
explain SELECT 字段列表 FROM 表名 HWERE 条件;

mysql> explain select * from gorm_db.user;
+----+-------------+-------+------------+------+---------------+------+---------+------+------+----------+-------+
| id | select_type | table | partitions | type | possible_keys | key  | key_len | ref  | rows | filtered | Extra |
+----+-------------+-------+------------+------+---------------+------+---------+------+------+----------+-------+
|  1 | SIMPLE      | user  | NULL       | ALL  | NULL          | NULL | NULL    | NULL |    1 |   100.00 | NULL  |
+----+-------------+-------+------------+------+---------------+------+---------+------+------+----------+-------+
1 row in set, 1 warning (0.00 sec)
1
2
3
4
5
6
7
8
9
10
11
2
3
4
5
6
7
8
9
10
11
explain 各字段含义:
id:select 查询的序列号,表示查询中执行 select 子句或者操作表的顺序(id相同,执行顺序从上到下;id不同,值越大越先执行)

select_type:表示 SELECT 的类型,常见取值有 SIMPLE(简单表,即不适用表连接或者子查询)、PRIMARY(主查询,即外层的查询)、UNION(UNION中的第二个或者后面的查询语句)、SUBQUERY(SELECT/WHERE之后包含了子查询)等

type:表示连接类型,性能由好到差的连接类型为 NULL、system、const、
eq_ref、ref、range、index、all

possible_key:可能应用在这张表上的索引,一个或多个

Key:实际使用的索引,如果为 NULL,则没有使用索引

Key_len:表示索引中使用的字节数,该值为索引字段最大可能长度,并非实际使用长度,在不损失精确性的前提下,长度越短越好

rows:MySQL认为必须要执行的行数,在InnoDB引擎的表中,是一个估计值,可能并不总是准确的

filtered:表示返回结果的行数占需读取行数的百分比,filtered的值越大越好
1
2
3
4
5
6
7
8
9
10
11
12
13
14
15
16
2
3
4
5
6
7
8
9
10
11
12
13
14
15
16
← mysql 中的索引结构 索引使用原则 →